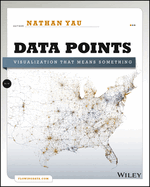
A fresh look at visualization from the author of Visualize This Whether it's statistical charts, geographic maps, or the snappy graphical statistics you see on your favorite news sites, the art of data graphics or visualization is fast becoming a movement of its own. In Data Points: Visualization That Means Something , author Nathan Yau presents an intriguing complement to his bestseller Visualize This , this time focusing on the graphics side of data analysis. Using examples from art, design, business, statistics, ...
Read More
A fresh look at visualization from the author of Visualize This Whether it's statistical charts, geographic maps, or the snappy graphical statistics you see on your favorite news sites, the art of data graphics or visualization is fast becoming a movement of its own. In Data Points: Visualization That Means Something , author Nathan Yau presents an intriguing complement to his bestseller Visualize This , this time focusing on the graphics side of data analysis. Using examples from art, design, business, statistics, cartography, and online media, he explores both standard-and not so standard-concepts and ideas about illustrating data. Shares intriguing ideas from Nathan Yau, author of Visualize This and creator of flowingdata.com, with over 66,000 subscribers Focuses on visualization, data graphics that help viewers see trends and patterns they might not otherwise see in a table Includes examples from the author's own illustrations, as well as from professionals in statistics, art, design, business, computer science, cartography, and more Examines standard rules across all visualization applications, then explores when and where you can break those rules Create visualizations that register at all levels, with Data Points: Visualization That Means Something .
Read Less
Add this copy of Data Points: Visualization That Means Something to cart. $28.39, new condition, Sold by GreatBookPrices rated 4.0 out of 5 stars, ships from Columbia, MD, UNITED STATES, published 2013 by Wiley.
Choose your shipping method in Checkout. Costs may vary based on destination.
Seller's Description:
New. Trade paperback (US). Glued binding. 320 p. Contains: Tables, black & white, Maps, Figures. In Stock. 100% Money Back Guarantee. Brand New, Perfect Condition, allow 4-14 business days for standard shipping. To Alaska, Hawaii, U.S. protectorate, P.O. box, and APO/FPO addresses allow 4-28 business days for Standard shipping. No expedited shipping. All orders placed with expedited shipping will be cancelled. Over 3, 000, 000 happy customers.
Add this copy of Data Points: Visualization That Means Something Format: to cart. $28.40, new condition, Sold by indoo rated 4.0 out of 5 stars, ships from Avenel, NJ, UNITED STATES, published 2013 by Wiley.
Add this copy of Data Points to cart. $40.65, new condition, Sold by Ria Christie Books rated 5.0 out of 5 stars, ships from Uxbridge, MIDDLESEX, UNITED KINGDOM, published 2013 by Wiley.
Add this copy of Data Points: Visualization That Means Something to cart. $43.94, new condition, Sold by Ria Christie Books rated 5.0 out of 5 stars, ships from Uxbridge, MIDDLESEX, UNITED KINGDOM, published 2013 by Wiley.